The scaling of the legend can be changed manually by clicking on the arrows below the colour scale. However, the entire scaling can also be changed. Clicking in the unit field, for example (default setting "N/cm²"), takes you to the "Definition legend" menu.

Legende
Legende-bearbeiten

The following functions are used to define new legends, or predefined legends can be called up and changed. Predefined legends are selected via the list field. If you click on the arrow in the list field, the available options are displayed.

A player function is inserted at the bottom right of the control panel. This ensures that the dynamic measurement runs automatically. Clicking on the ">" play button starts the measurement automatically. When the measurement is running, a vertical line moves across the force-time curves at the bottom of the screen. Clicking the play button again stops the process and the vertical line remains at the corresponding position. As before, it is also possible to run the programme manually using the mouse or the cursor keys. By changing the percentage next to the player functions, it is possible to slow down the sequence from 30% to 100%. If the automatic sequence is paused, the measurement can be switched forwards and backwards in individual frames using the two arrow keys next to the play button.

Playerfunktion

When the Comparison option is activated (click on ..., select comparison measurement, tick the Comparison box), the "Basic analysis" and "Professional analysis" boxes become active. These provide a comparison of the measurement data for the two measurements displayed. After clicking on one of the two options, a table appears at the bottom of the screen in which various measurement data are compared with each other.

The basic analysis is divided into rearfoot and forefoot. The maximum pressure and impulse parameters are listed next to each other and the percentage deviations of the compared measurements are calculated.

The professional analysis is divided into all foot zones (standard - 6 zones). The parameters maximum pressure, average pressure, loaded area, impulse, force and force rate are listed next to each other and the percentage deviations of the compared measurements are calculated.

Basis-Analyse

Figure 19: Basic analysis


Profi-Analyse

Figure 20: Profile analysis

By activating the checkbox "Hydrograph" button, a graph is shown in the measurement display. The centre of pressure is calculated at each point in the measurement. This is marked as a point in the dynamic progression. The hydrograph therefore represents the connection of the pressure centres of all individual images and is to be interpreted as the point of application of the body's centre of gravity.

Ganglinie

Figure 18: Hydrograph

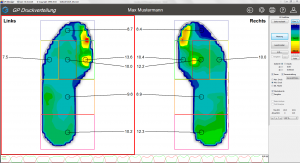
By activating the checkbox "Zones" and the selection of an associated parameter "Max. Pressure„, „Print centre" or "Bel. Area" button, the corresponding values of the zones are displayed on the workspace.

A distinction must be made here as to whether the values for a specific point in time (time diagram) or the specific areas "Max. Pressure„, „Medium pressure" or "Bel. Area" should be displayed.

Mittlerer Druck je Zone

Figure 17: Average pressure per zone

Ansicht der verschiedenen Zonen deren maximale Druckwerte

Figure 13: View of the different zones and their maximum pressure values

Zone definition

It is now possible to edit the zones manually. This function is only possible if the axis is set, or in other words, if the "Axis" box is not ticked. All changes made on one foot side are automatically transferred to the other foot side. Operation is carried out by holding down the Ctrl key. There are several options:

  1. Change an existing zone
    • click on the zone to be changed while holding down the Ctrl key and change the size of the zone at the corner or side points with the mouse, or change the position of the zone while holding down the mouse button in the zone
    • double-click in the zone while holding down the Ctrl key to open a new window (see Fig. 1). Here you can enter the name, move the sliders to change the colour and enter the coordinates to change the size and position of the zone.
  2. Define a new zone
    • A window can be opened by holding down the Ctrl plus Shift key. This is then a new zone and can now be edited in the same way as under 1.) "Change existing zone".

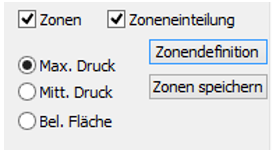
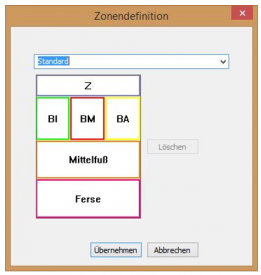
If a change has been made under 1.) or 2.), the option "Save zones" appears (see Fig. 2). The changed zone can be overwritten there or a new zone can be created. In the latter case, a new name must be entered for the zone. Click on "Zone definition" to select from the list of zones already created (see Fig. 3). The selected zoning is displayed graphically and it is possible to delete a previously defined zoning.

Zone verändern

Figure 14: Change zone


Zone speichern

Figure 15: Save zone


Zonendefinition

Figure 16: Zone definition


The "Maximum values" checkbox causes the maximum value of each sensor to be displayed in the displayed period of the force-time diagram.

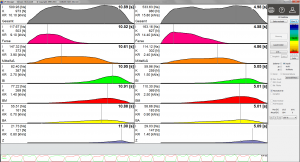
After activating the "Impulse, force, force rate" radio button, gait patterns are displayed in the form of force-time diagrams. All defined zones are taken into account. In addition, an overall force curve (grey here) is displayed.

The diagrams are based on one step each (right and left). The step that comes closest to the average contact time of all steps is displayed.

Common to all diagrams is the visualisation of the relevant biomechanical parameters:

  • Pulse [Ns]
  • Force [N]
  • Force rate [kN/s]
  • Time [s]
Impuls Diagramme

Figure 12: Pulse diagrams

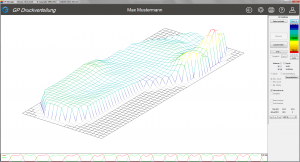
The "3 D" radio button causes a change to a 3D print image. Please note that this only applies to the gait pattern of the active zone (red rectangle). The "Change side" button retains its function, so that a quick switch to the other measured foot side is possible with a simple mouse click.

3D Druckgebirge

Figure 11: 3D printed mountains

You can view the measurement from different perspectives by clicking in the workspace and rotating the measurement while holding down the left mouse button. The direction of rotation is determined by the following key combination and mouse movement:

Key combination Mouse movement Direction of rotation
Left mouse button horizontal around the y-axis
right mouse button Vertical around the x-axis

By moving the mouse vertically while holding down the CTRL key, the print area is raised or flattened. This function can be useful when preparing a printout.

After activating the "2D" radio button, gear images are displayed in the form of colour fields.

2D Darstellung

Figure 10: 2D representation