To compare two measurements with each other, you must first select a data set for comparison. To do this, click on the button: ![]() This is located to the right of
This is located to the right of![]() .
.
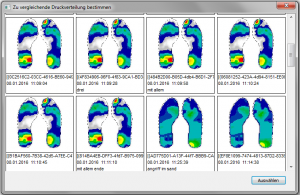
You can select a comparison measurement in the following preview window:
Select a comparison measurement by clicking on it. Now confirm this selection with the "Select" button.
To see the selected comparison, you must tick the checkbox before the comparison. If you deactivate the checkbox, you will return to the initial measurement.
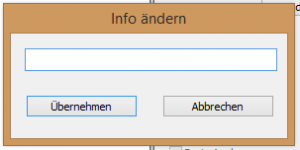
After clicking on "Info" button, you can enter information about the measurement in a dialogue box that is displayed in the display area.
The information is entered in the text line and confirmed by clicking on "Take over" is displayed directly in the respective display area. After clicking on "Cancel" the entry is discarded.
Attention:
If you have opened the dialogue and do not want to change the entry, click on "Take over".
If a measurement has been zoomed in the force-time diagram, the remaining part of the measurement can be deleted using the "Cut" function, i.e. only the part of the measurement that is currently visible is saved. The function is carried out without prompting, so it should be used with caution.
Click on the "Change page" button to change the active zone (red rectangle) of the display area. Another way to change the active zone is to click once with the left mouse button in the corresponding zone.
The force-time diagram is located below the display area. In it, the total force is plotted as a function of time. The total force of the left foot is shown as a red line and that of the right foot as a green line.
A simple left mouse click in the diagram selects a point in time and displays the respective pressure distribution image in the display area. The selected point is indicated by a black vertical marker. At the same time, the current force values are displayed in the "Current [N]" line in the force display area. The selected point in time appears in the top right-hand corner of the diagram.
If you move the marker while holding down the left mouse button, a "quasi real-time" display of the gait pattern is shown. The right or left arrow key on the keyboard offers another option for scrolling through the gait pattern. The scrolling direction corresponds to the arrows.
You can also zoom in on a specific area of the diagram. To do this, press the CTRL key and simultaneously drag a rectangle with the mouse (left mouse button) over the area to be zoomed. The entire measurement is displayed again by left-clicking while holding down the CTRL key.
On the display area of GP FootPrint the gait patterns are displayed after a measurement or after opening a measurement. However, the measurements of other measuring surfaces (e.g. hand, arm, etc.) can also be displayed. With a click on the ![]() symbol, older measurements of the customer can be selected.
symbol, older measurements of the customer can be selected.
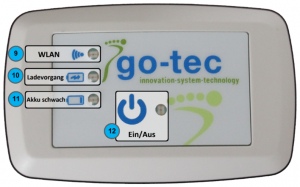
- Firstly, please charge the two MODA WiFi transmitters (1). To do this, connect them to the USB port of your computer using the enclosed charging cable (3). During the first charging process, it is important that the computer is connected to the Internet so that Windows can download a corresponding driver. The transmitter is charging when the LED (10) lights up orange and is fully charged when the LED goes out again. A complete charging process takes approx. 3 hours. The battery life of the transmitter is around 8 hours. When the battery is low, the LED (11) lights up red. Alternatively, the transmitters can also be charged using a USB socket adapter, similar to (7).
Remark:
If you do not use the transmitter for several weeks, please charge the battery beforehand. Otherwise a deep discharge may occur. This is harmful to a lithium-ion battery! - Install the GP Manager from the enclosed data carrier.
- The router (4) must be supplied with power during the measurement process. There are two ways of doing this, depending on the area of application. If you mainly use MobilData WiFi within the same premises, it is advantageous to connect the router to a nearby power socket. Use the charging cable (6) and the supplied adapter (7) for this. For mobile applications, you can supply the router with power via the USB port of your computer/laptop.Remark: Please do not press the reset button on the router. This would mean that you would no longer be able to carry out measurements, as important settings would be deleted.
- Data is transferred between the transmitter and computer via WLAN. The WLAN stick turns your computer into a WLAN-capable end device. Please plug the WLAN stick (5) into a free USB port on your computer.
Attention:
It is strongly recommended to connect the stick to the computer via a USB extension. Due to the shielding effect of the computer housing and interference fields arising in the computer, problems may otherwise occur with the connection and/or the measurement.
In addition, Bluetooth devices transmit in the same frequency range, which further impairs the connection. A greater distance from these sources of interference leads to a more stable connection.The stick installs itself automatically if an Internet connection is available. If your PC already has a WLAN interface because you are using MobilData on a laptop, for example, you can also use the internal WLAN interface on your device.


