The function "Measurement" is used to read out the SRAM card of the data logger or log files on the hard drive and the soles with direct connection. With a left mouse click on the button "Measurement" opens the window for data transfer. Depending on which product you have chosen, there are different procedures at this point.

Note:
The following must be observed when working and assigning measurements:
Only the assignment of a measurement to a customer makes it possible to work with the measurement. This is absolutely the following sequence:

  • Creating/calling up the customer
  • Selecting the sole combination
  • Reading/calibrating/assigning the measurement

SQL_MDLogger Messung

With a click on "Cancel" button closes the dialogue and you return directly to the "GP foot pressure" module without accepting a measurement.

With the function "Accept measurement" button ends a measurement that has been started and is transferred and displayed directly in the "GP FussMess" display area.

By clicking on "Start measurement" button starts a recording of the measurement. The measurement is recorded until the "Accept measurement" is clicked.

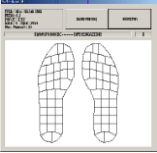
The function "Measurement" is used to record measured values from the wireless system. After clicking on "Measurement" to switch to the window below.

Messen1

If measuring surfaces are connected to the transmitter and the transmitter is switched on, the measuring surfaces are shown directly on the display.

Messen2

All measuring surfaces have a unique coding. However, the prerequisite for the display is a correct calibration file. Each measuring surface is delivered calibrated by GeBioM mbH. The corresponding calibration file must be located in the subfolder \GPSYSTEM\KAL.

A player function is inserted at the bottom right of the control panel. This ensures that the dynamic measurement runs automatically. By clicking on the play button ">" button, the measurement runs automatically. When the measurement is running, a vertical line moves across the force-time curves at the bottom of the screen. Clicking the play button again stops the sequence and the vertical line remains at the corresponding position. As before, manual sequencing with the mouse or using the cursor keys is also possible. By changing the percentage next to the player functions, it is possible to slow down the sequence from 30% to 100%. If the automatic sequence is paused, the measurement can be switched forwards and backwards in individual frames using the two arrow keys next to the play button.

MD_Player
MD_Zeitachse

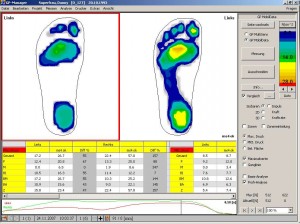
When the Comparison option is activated (click on ..., select Comparison measurement, tick the Comparison box), the "Basic analysis" and "Professional analysis" are active. These provide a comparison of the measurement data for the two measurements displayed. After clicking on one of the two options, a table appears at the bottom of the screen in which various measurement data are compared with each other.

The basic analysis is divided into rearfoot and forefoot. The maximum pressure and impulse parameters are listed next to each other and the percentage deviations of the compared measurements are calculated.

The professional analysis is divided into all foot zones (standard - 6 zones). The parameters maximum pressure, average pressure, loaded area, impulse, force and force rate are listed next to each other and the percentage deviations of the compared measurements are calculated.

MD_BasisAnalyse

Illustration: Basic analysis

MD_ProfiAnalyse

Illustration: Professional analysis

By activating the checkbox "Hydrograph" button, a graph is shown in the measurement display. The centre of pressure is calculated at each point in the measurement. This is marked as a point in the dynamic progression. The hydrograph therefore represents the connection of the pressure centres of all individual images and is to be interpreted as the point of application of the body's centre of gravity.

SQL_FussDruck_Ganglinie