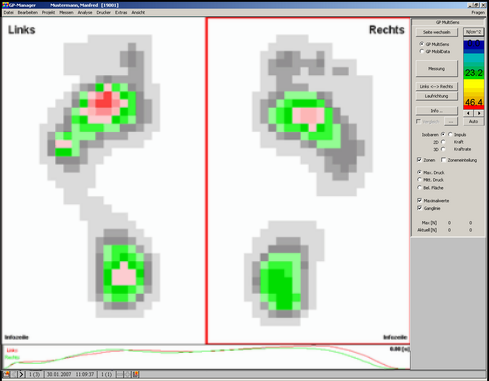
By activating the "Zones" checkbox and selecting an associated parameter "Max. pressure", "Aver. pressure" or "Bel. Area", the corresponding values of the zones are displayed on the work surface.

A distinction must be made here as to whether the values for a specific point in time (time diagram) or the specific areas "Max. pressure", "Average pressure" or "Bel. Area" should be displayed.

MS_Zonen

By activating the checkbox "Zoning" button displays all defined zones.

MS_Zoneneinteilung

The checkbox "Maximum values" causes the maximum value of each sensor to be displayed in the displayed period of the force-time diagram.

After activating the "Impulse, force, force rate" radio button, gait patterns are displayed in the form of force-time diagrams. All defined zones are taken into account. In addition, an overall force curve (grey here) is displayed.

The diagrams are based on one step each (right and left). The step that comes closest to the average contact time of all steps is displayed.

Common to all diagrams is the visualisation of the relevant biomechanical parameters:

  • Pulse [Ns]
  • Force [N]
  • Force rate [kN/s]
  • Time [s]

SQL_MS Impluse Kraft

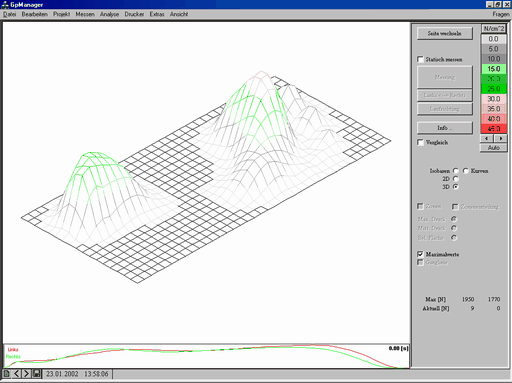
The "3 D" radio button causes a change to a 3D print image. Please note that this only applies to the gait pattern of the active zone (red rectangle). The "Change side" button retains its function, so that a quick switch to the other measured foot side is possible with a simple mouse click.
MS_3D
clip0005

You can view the measurement from different perspectives by clicking in the workspace and rotating the measurement while holding down the left mouse button. The direction of rotation is determined by the following key combination and mouse movement:

Key combination Mouse movement Direction of rotation
Left mouse button horizontal around the y-axis
Left mouse button Vertical around the x-axis

By moving the mouse vertically while holding down the CTRL key, the print area is raised or flattened. This function can be useful when preparing a printout.

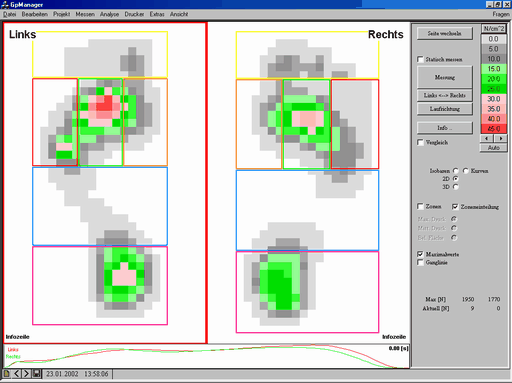
After activating the radio button "2D", gear images are displayed in the form of colour fields.

SQL_MS 2D

In the default setting, hydrographs are displayed in the form of isobars. This graphic shows the uniform pressure distribution. The option field "Isobars" is activated.

MS_Isobaren

After clicking on "Info" you can enter information on the data record in a dialogue box, which is displayed in the display area.

SQL_FussDruck Info

Enter the information in the text line and click on "Take over" is displayed directly in the respective display area. After clicking on "Cancel" the entry is discarded.

Attention:
If there is already information in the field, click on "Cancel" to delete it!

If a measurement has been zoomed in the force-time diagram, you can use the "Cut out", the remaining part of the measurement can be deleted, i.e. only the part of the measurement that is currently visible is saved. The function is carried out without prompting, so it should be used with caution.

This function can be used to change the display of the running direction, i.e. after clicking the button, the displayed gait pattern is rotated by 180°. Please note that this only affects the active zone (red rectangle) of the workspace (to change the active zone, see "Change page„).

Note:
The orientation of the foot on the screen must always be such that the toes are at the top and the heel at the bottom of the screen. The orientation must be adhered to as it is required for the calculation of certain methods (e.g. impulse).