3. software module GP Balance
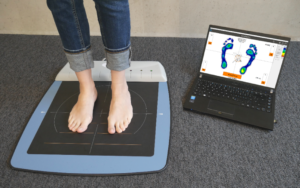
With the software module GP Balance the plantar pressure distribution is measured while standing. The centre of gravity of the pressure calculated from this provides information on how well the person can maintain their balance.
3.1 Overview
To start the module, you must first select a customer or create a new one. To do this, click on the following symbol at the top right . To create a new customer, click on and fill in at least the mandatory fields marked with an *. The arrow then takes you back to the start page and you can start the GP Balance module.

3.2 Perform measurement
Once the pressure measuring plate has been switched on and connected (see 2.2 Installation and commissioning), the measurement can be started. One person stands barefoot with both feet on the pressure measuring plate and tries to stand as still as possible. Click on "Measure" to start the measurement.
3.2.1 Time
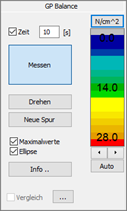
The measuring time is set to 10 s as standard. This means that the measurement is automatically ended 10 seconds after the start. If desired, a different measurement time can be set or the measurement can be started and stopped as required by deactivating the "Time" tick box using the "Measure" button. The target measurement time and the current measurement time are displayed to the right of the pressure distribution.
3.2.2 Turning
The "Rotate" button allows you to rotate the view in 90° increments. This is only possible during the live measurement, not afterwards.
3.2.3 New track
Clicking on the "New track" button restarts the live measurement, i.e. the time starts again at 0 and the previously recorded pressure values are deleted. This can be useful if the person was not ready at the beginning.
3.2.4 Maximum values
By default, the totalised pressure distribution is always displayed for the balance measurement (maximum values). If the corresponding tick box is deactivated, only the current pressure distribution is displayed.
3.2.5 Ellipse
The ellipse provides information about the person's stability. It is calculated automatically on the basis of the centre of gravity data and is displayed as an orange circle. The ellipse can be deactivated by ticking the box. Then only the course of the centre of gravity is shown. You can find out more about analysing the balance measurement using the ellipse under 3.3.4.
3.3 Presentation and analysis
After the measurement time has elapsed or the measurement has been stopped with the "Measure" button, the saved measurement appears on the user interface. The measurement time is displayed to the right of the pressure measurement.
Older measurements of the customer can be selected by clicking on the top right.
3.3.1 Info
By clicking on "Info...", you can enter information about the recorded measurement. This is then displayed in the display area at the top left.

3.3.2 Legend
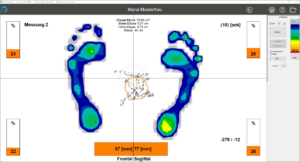
The pressure in the respective foot region is displayed as a coloured isobaric representation. The altitude can be determined using the legend on the right-hand side. The warmer the colour, the higher the pressure. The unit of pressure is given as standard in Newtons per cm² (N/cm²). In a balance measurement, a pressure range of approx. 14 N/cm² is shown in green and the foot region that exceeds a pressure value of 28 N/cm² is shown in red.
3.3.3 Centre of gravity (COP)
The software calculates the person's centre of pressure at all times. The COP (centre of pressure) is displayed as small squares in the software. The maximum deflection of the COP in the frontal and sagittal planes is shown in mm at the bottom of the screen.
3.3.4 Ellipse
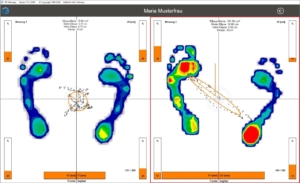
The ellipse provides information about the person's stability. It is calculated automatically on the basis of the centre of gravity data and is displayed as an orange circle. The parameters of the ellipse are displayed above the pressure distribution. The larger the area of the ellipse, the greater the fluctuation in general. The angle indicates the orientation of the ellipse and therefore the direction of the fluctuation. Examples
- 0° = forwards/backwards
- 45° from rear left to front right
- -45° from rear right to front left
3.3.5 Crosshairs and percentage pressure distribution
The thin, black horizontal and vertical lines are intended to represent a crosshair (see Figure 5). The orange bars in the corners of the display area indicate the percentage distribution of the pressure in the four fields of the crosshairs. In Figure 5, for example, the left forefoot is loaded with 24% and the hindfoot with 22% of the total pressure. The crosshairs can be positioned accordingly by holding down the mouse button. If the crosshairs in Figure 5 were drawn vertically to the bottom edge of the image in the centre, the percentage distribution right-left foot is shown.
3.3.6 Comparison
You can compare the currently open measurement with another measurement. To do this, click on the button and select the desired comparison measurement in the preview window.
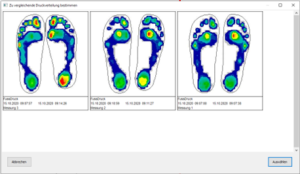
To view the selected comparison, you must tick the checkbox in front of the comparison.
If you deactivate the checkbox, you will return to the initial measurement.
The illustration shows a comparison of two measurements. When looking at the ellipse and the orange bars, it is easy to see that the person on the left is standing relatively still, whereas the person on the right is swaying very strongly from the left forefoot to the right hindfoot.
3.4 Printing
Measurements can be printed out by clicking on the printer symbol (top right). Various display options are available to you. If the comparison is active, the comparison is printed.
