Presentation and analysis
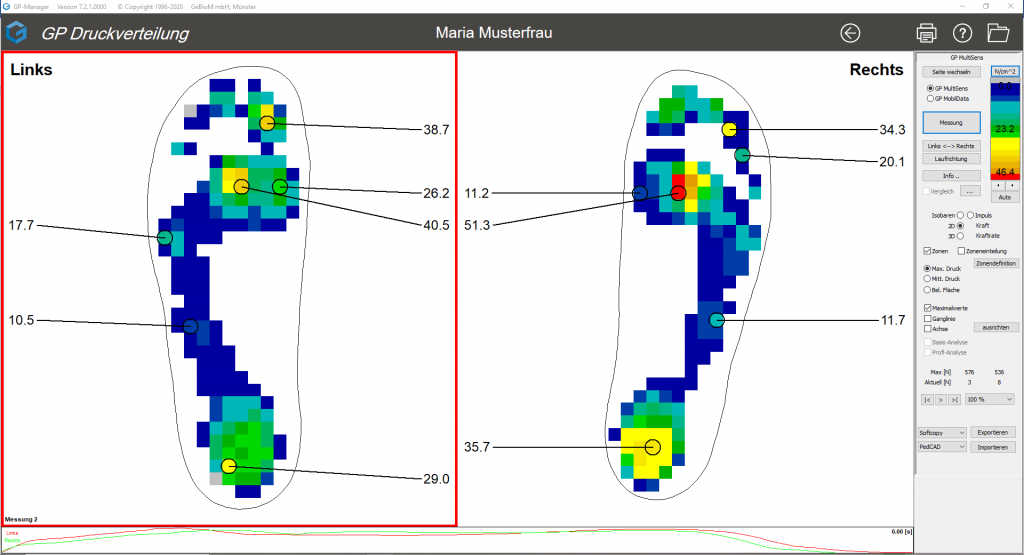
After a measurement, the totalised pressure distribution is displayed (see Figure 5). The colour of the display provides information about the level of pressure. With a click on ![]() At the top right, older measurements of the customer can be selected.
At the top right, older measurements of the customer can be selected.

Figure 5: Illustration of the pressure distribution