Manual - GP MobilData V7
1.Important information
Please read the following information, as it contains important information on how to use the MobilData measuring system.
Attention:
If you use the transmitter for several weeks Do not use, Please charge the battery first. Otherwise a deep discharge may occur. This is harmful to a lithium-ion battery! To prevent damage to the battery during longer storage periods Check the charge status of the batteries every 4-6 weeks to avoid deep discharge of the batteries.
To extend the service life, the batteries should be not over a longer period of time be exposed to high temperatures. Make sure that you store the batteries at temperatures below 30 °C store.
1.1.General information
With the GP MobilData WiFi pressure measurement system, you can record the plantar pressure load in the shoe.
The data from the sensors is sent directly to the PC using a WiFi transceiver and stored there, allowing your customer to move freely. The flexible measuring soles have 40 to 64 sensors per sole, depending on the shoe size. The maximum measuring frequency is 200 Hz and the resolution of the measured values is 12 bit, so that sporting movements can be recorded with a high degree of accuracy. The range of the measuring distance varies between 15 m inside buildings and around 100 m in open space. The measuring surfaces of the systems can be customised. Customised designs for special applications such as butt, Charcot or crescent bases are possible. The measuring surfaces are repairable and can be calibrated again and again, guaranteeing a long service life.
1.2.Intended use
The target user group for the systems is not made up of end users, but of specialist groups (engineers, orthopaedic (shoe) technicians, biomechanics specialists, etc.) from the various sectors:
- Orthopaedic (shoe) technology
- Sports biomechanics
- Automotive industry
- Mattress industry
- Seating industry
The user of the GeBioM pressure distribution measuring systems is always given an intensive introduction when the systems are delivered, usually even on site. This includes basic handling of the systems, exclusion criteria for certain measurement situations (e.g. do not use sharp objects, etc.) and an introduction to the evaluation options of the respective system. The specialist knowledge required to analyse the results can be assumed. The devices cannot be used contrary to their intended purpose according to normal judgement. The measures taken by the user based on the respective measurement results are always subject to his personal expertise and philosophy.
The systems are designed in such a way that the respective test person (in industry usually employees of the respective department, in sales counselling the customer, in orthopaedic (shoe) technology the customer/patient) is not significantly influenced by sitting on or walking on the measurement sensors. Where necessary, the measurement technology is also applied to the test subject by the professional user. Otherwise, the test person simply walks over the measuring field, lies on it or wears the measuring foils in their shoes.
Important:
Care must be taken to ensure that the measuring foils or sensors are not damaged by sharp objects.
objects. This could cause the sensor system to fail.
1.3.Calibration cycles
GeBioM recommends regular calibration of the measuring foils or sensors by the manufacturer, at least once a year. If the systems are used almost daily, this should be repeated more often. In the case of industry, however, this can also be done by an appropriately equipped and instructed specialised laboratory. Due to the special calibration procedure, instructions are required. The manufacturer should be consulted for this.
2.1.Connections
Attach the transmitters to the lower legs using the leg straps. Then connect the sole to the transmitters. Please ensure that the assignment between the transmitters and the soles is correct. The transmitters and soles are each labelled with an "R" for right and an "L" for left. Also make sure that the soles engage correctly in the transmitters.
Connect the WLAN stick to a USB port (USB 2.0 is essential) on your PC. Connect the router to a free socket nearby using the charging cable.
2.2.Installation
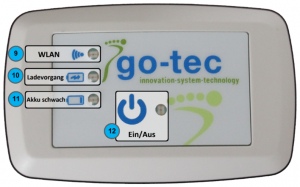
- Firstly, please charge the two MODA WiFi transmitters (1). To do this, connect them to the USB port of your computer using the enclosed charging cable (3). During the first charging process, it is important that the computer is connected to the Internet so that Windows can download a corresponding driver. The transmitter is charging when the LED (10) lights up orange and is fully charged when the LED goes out again. A complete charging process takes approx. 3 hours. The battery life of the transmitter is around 8 hours. When the battery is low, the LED (11) lights up red. Alternatively, the transmitters can also be charged using a USB socket adapter, similar to (7).
Remark:
If you do not use the transmitter for several weeks, please charge the battery beforehand. Otherwise a deep discharge may occur. This is harmful to a lithium-ion battery! - Install the GP Manager from the enclosed data carrier.
- The router (4) must be supplied with power during the measurement process. There are two ways of doing this, depending on the area of application. If you mainly use MobilData WiFi within the same premises, it is advantageous to connect the router to a nearby power socket. Use the charging cable (6) and the supplied adapter (7) for this. For mobile applications, you can supply the router with power via the USB port of your computer/laptop.Remark: Please do not press the reset button on the router. This would mean that you would no longer be able to carry out measurements, as important settings would be deleted.
- Data is transferred between the transmitter and computer via WLAN. The WLAN stick turns your computer into a WLAN-capable end device. Please plug the WLAN stick (5) into a free USB port on your computer.
Attention:
It is strongly recommended to connect the stick to the computer via a USB extension. Due to the shielding effect of the computer housing and interference fields arising in the computer, problems may otherwise occur with the connection and/or the measurement.
In addition, Bluetooth devices transmit in the same frequency range, which further impairs the connection. A greater distance from these sources of interference leads to a more stable connection.The stick installs itself automatically if an Internet connection is available. If your PC already has a WLAN interface because you are using MobilData on a laptop, for example, you can also use the internal WLAN interface on your device.
3.Perform measurement
- Ensure that the router is connected to the power supply.
- Check whether the WLAN stick is connected to the USB port of your computer or whether you have switched on the laptop's internal WLAN.
- Please connect the measuring soles to the transmitters. Pay attention to the correct labelling (L = left; R = right).Attention:
Make sure that the plug engages correctly! - Now place the soles in the shoes and attach the two transmitters to the customer's lower leg using the leg straps (8). The cable should not be under tension (see Figure 1)!
- Switch on the transmitter (12). If the transmitter is switched on, the adjacent LED lights up. After a few seconds, the WLAN LED (9) on your transmitter lights up. This means that the transmitter is correctly connected to the router (see Figure 2).
- Now establish a connection between the computer and the router. To do this, click on the network symbol (
 or
or  ) in the bottom right corner of the screen. Click on "MODA WiFi router" (see Figure 3). The "Establish connection automatically" tick box should remain ticked.
- Then click on "Connect". The password is: 12345678
- A message may appear stating that the connection was not successful and connectivity is restricted (see Figure 3). This message can be closed as it simply indicates that the router has no connection to the Internet. The network symbol is marked with an exclamation mark
 .
.
- Now open the already installed GP Manager and start a measurement.
4.1.1.Display areas
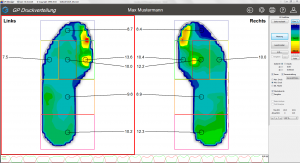
On the display area of GP FootPrint the gait patterns are displayed after a measurement or after opening a measurement. However, the measurements of other measuring surfaces (e.g. hand, arm, etc.) can also be displayed. With a click on the ![]() symbol, older measurements of the customer can be selected.
symbol, older measurements of the customer can be selected.
4.1.2.Force-time diagram
The force-time diagram is located below the display area. In it, the total force is plotted as a function of time. The total force of the left foot is shown as a red line and that of the right foot as a green line.
A simple left mouse click in the diagram selects a point in time and displays the respective pressure distribution image in the display area. The selected point is indicated by a black vertical marker. At the same time, the current force values are displayed in the "Current [N]" line in the force display area. The selected point in time appears in the top right-hand corner of the diagram.
If you move the marker while holding down the left mouse button, a "quasi real-time" display of the gait pattern is shown. The right or left arrow key on the keyboard offers another option for scrolling through the gait pattern. The scrolling direction corresponds to the arrows.
You can also zoom in on a specific area of the diagram. To do this, press the CTRL key and simultaneously drag a rectangle with the mouse (left mouse button) over the area to be zoomed. The entire measurement is displayed again by left-clicking while holding down the CTRL key.
4.1.3.Change pages
Click on the "Change page" button to change the active zone (red rectangle) of the display area. Another way to change the active zone is to click once with the left mouse button in the corresponding zone.
4.1.4.Cut out
If a measurement has been zoomed in the force-time diagram, the remaining part of the measurement can be deleted using the "Cut" function, i.e. only the part of the measurement that is currently visible is saved. The function is carried out without prompting, so it should be used with caution.
4.1.5.Info
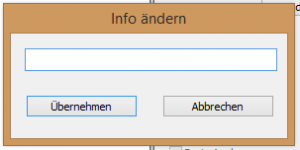
After clicking on "Info" button, you can enter information about the measurement in a dialogue box that is displayed in the display area.
The information is entered in the text line and confirmed by clicking on "Take over" is displayed directly in the respective display area. After clicking on "Cancel" the entry is discarded.
Attention:
If you have opened the dialogue and do not want to change the entry, click on "Take over".
4.1.6.Comparison
To compare two measurements with each other, you must first select a data set for comparison. To do this, click on the button: ![]() This is located to the right of
This is located to the right of![]() .
.
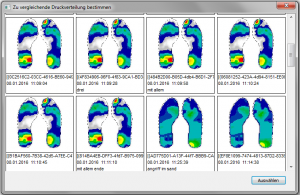
You can select a comparison measurement in the following preview window:
Select a comparison measurement by clicking on it. Now confirm this selection with the "Select" button.
To see the selected comparison, you must tick the checkbox before the comparison. If you deactivate the checkbox, you will return to the initial measurement.
4.1.9.3D
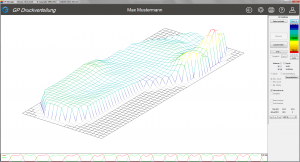
The "3 D" radio button causes a change to a 3D print image. Please note that this only applies to the gait pattern of the active zone (red rectangle). The "Change side" button retains its function, so that a quick switch to the other measured foot side is possible with a simple mouse click.
You can view the measurement from different perspectives by clicking in the workspace and rotating the measurement while holding down the left mouse button. The direction of rotation is determined by the following key combination and mouse movement:
| Key combination | Mouse movement | Direction of rotation |
|---|---|---|
| Left mouse button | horizontal | around the y-axis |
| right mouse button | Vertical | around the x-axis |
By moving the mouse vertically while holding down the CTRL key, the print area is raised or flattened. This function can be useful when preparing a printout.
4.1.10.Impulse, force, force rate
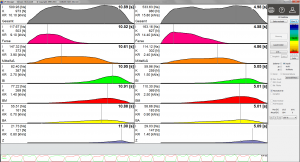
After activating the "Impulse, force, force rate" radio button, gait patterns are displayed in the form of force-time diagrams. All defined zones are taken into account. In addition, an overall force curve (grey here) is displayed.
The diagrams are based on one step each (right and left). The step that comes closest to the average contact time of all steps is displayed.
Common to all diagrams is the visualisation of the relevant biomechanical parameters:
4.1.11.Maximum values
The "Maximum values" checkbox causes the maximum value of each sensor to be displayed in the displayed period of the force-time diagram.
4.1.12.Zoning
Zone definition
It is now possible to edit the zones manually. This function is only possible if the axis is set, or in other words, if the "Axis" box is not ticked. All changes made on one foot side are automatically transferred to the other foot side. Operation is carried out by holding down the Ctrl key. There are several options:
- Change an existing zone
- click on the zone to be changed while holding down the Ctrl key and change the size of the zone at the corner or side points with the mouse, or change the position of the zone while holding down the mouse button in the zone
- double-click in the zone while holding down the Ctrl key to open a new window (see Fig. 1). Here you can enter the name, move the sliders to change the colour and enter the coordinates to change the size and position of the zone.
- Define a new zone
- A window can be opened by holding down the Ctrl plus Shift key. This is then a new zone and can now be edited in the same way as under 1.) "Change existing zone".
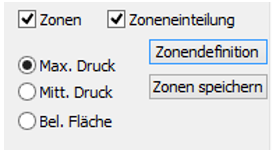
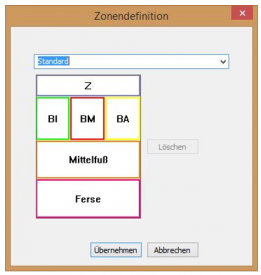
If a change has been made under 1.) or 2.), the option "Save zones" appears (see Fig. 2). The changed zone can be overwritten there or a new zone can be created. In the latter case, a new name must be entered for the zone. Click on "Zone definition" to select from the list of zones already created (see Fig. 3). The selected zoning is displayed graphically and it is possible to delete a previously defined zoning.
4.1.13.Zones
By activating the checkbox "Zones" and the selection of an associated parameter "Max. Pressure„, „Print centre" or "Bel. Area" button, the corresponding values of the zones are displayed on the workspace.
A distinction must be made here as to whether the values for a specific point in time (time diagram) or the specific areas "Max. Pressure„, „Medium pressure" or "Bel. Area" should be displayed.
4.1.14.Hydrograph
By activating the checkbox "Hydrograph" button, a graph is shown in the measurement display. The centre of pressure is calculated at each point in the measurement. This is marked as a point in the dynamic progression. The hydrograph therefore represents the connection of the pressure centres of all individual images and is to be interpreted as the point of application of the body's centre of gravity.
4.1.15.Basic analysis / Professional analysis
When the Comparison option is activated (click on ..., select comparison measurement, tick the Comparison box), the "Basic analysis" and "Professional analysis" boxes become active. These provide a comparison of the measurement data for the two measurements displayed. After clicking on one of the two options, a table appears at the bottom of the screen in which various measurement data are compared with each other.
The basic analysis is divided into rearfoot and forefoot. The maximum pressure and impulse parameters are listed next to each other and the percentage deviations of the compared measurements are calculated.
The professional analysis is divided into all foot zones (standard - 6 zones). The parameters maximum pressure, average pressure, loaded area, impulse, force and force rate are listed next to each other and the percentage deviations of the compared measurements are calculated.
4.1.16.Player function
A player function is inserted at the bottom right of the control panel. This ensures that the dynamic measurement runs automatically. Clicking on the ">" play button starts the measurement automatically. When the measurement is running, a vertical line moves across the force-time curves at the bottom of the screen. Clicking the play button again stops the process and the vertical line remains at the corresponding position. As before, it is also possible to run the programme manually using the mouse or the cursor keys. By changing the percentage next to the player functions, it is possible to slow down the sequence from 30% to 100%. If the automatic sequence is paused, the measurement can be switched forwards and backwards in individual frames using the two arrow keys next to the play button.
4.1.17.Legends
The scaling of the legend can be changed manually by clicking on the arrows below the colour scale. However, the entire scaling can also be changed. Clicking in the unit field, for example (default setting "N/cm²"), takes you to the "Definition legend" menu.
The following functions are used to define new legends, or predefined legends can be called up and changed. Predefined legends are selected via the list field. If you click on the arrow in the list field, the available options are displayed.
4.1.17.1.New
After clicking on "New", a new name "NN" appears in the list field. The new legend can later be found under this name in the list field. The name can be changed by clicking with the mouse in the "NN" field and entering a new name.
4.1.17.2.Colours
To define the colours, set the slider below the colour scale to the desired number of colours. This is displayed in the centre below the scale. You can set values between 1 and 64. Each individual colour must now be defined. To do this, double-click in the colour field to be defined and the Windows colour dialogue box will appear. Click on the desired base colour on the left. If required, this can be varied manually on the right in the square colour spectrum or in the brightness gradation next to it. The current colour is displayed in the "Colour / Base" field. Once the desired colour has been set, click on "Add colour". Make sure that the colour appears in the top left box under "User-defined colours", otherwise the colour will not be applied. Then click on "OK" and the colour will be entered in the colour scale. You must repeat this process for each colour box (or see "Calculate").
4.1.17.3.Calculate
The "Calculate" function is used to create a colour transition scale, i.e. after creating a start and end colour, the intermediate colours are calculated and entered by the program. To do this, define the start and end colours as described in the "Colours" section. Then click first on the start colour and then on the end colour while holding down the CTRL key. The colour values between the two boxes are calculated automatically.
4.1.17.4.font
You can use the "Font" button to change the colour of the text in the legend. This is done after clicking on it as described under "Colours".
4.1.17.5.Background
The "Background" button is used to set the background of a measurement. This is done after clicking on it as described under "Colours".
4.1.17.6.Autoscaling
If the "Auto scaling" checkbox is activated, the scaling is set to the maximum value. If the checkbox is deactivated, the scaling is set to the last set value.
4.1.17.7.Units
In the "Units" area, select the pressure units (mbar, N/cm², kPa or mmHg).
Note:
The displayed list also contains the units for the impulse [Ns] and [mNs]. Make sure that these units are not selected for the pressure.
4.1.17.8.Save
Click on "Save" to save the new settings. If you want to discard the changes, click on the crossed rectangle at the top right of the dialogue box.
5.Quick guide
- Select the "Customers" button on the start page and create a customer or search for an existing customer
- Use the arrow to accept customers and return to the start page
- Select GP foot pressure module
- Create measuring system for customers
- Soles in the shoes
- Attach transmitter to lower leg with leg straps
- Connecting transmitters and soles
- Plug the router into a nearby power socket
- Switch on the transmitter on the lower legs
- Click in the "Measurement" module
- When the programme is started for the first time, the calibration data for both soles is read in automatically - this can take a few minutes
- You can then start the measurement by pressing the "Start measurement" button
- Measurement data is recorded until the "Accept measurement" button is clicked
- The measurement is accepted and displayed


