1.Important information
1.1.General information
With the pressure measurement system GP MultiSens WiFi you can record the plantar pressure load when walking barefoot.
The pressure data from the measuring platform is sent directly to your PC via WLAN, where it is stored and analysed. The measuring platform has 2,304 pressure sensors distributed over a measuring area of 38 cm x 38 cm. The maximum measuring frequency is 200 Hz.
1.2.Intended use
The target user group for the systems is not made up of end users, but of specialist groups (engineers, orthopaedic (shoe) technicians, biomechanics specialists, trainers, etc.) from the various sectors:
- Orthopaedic (shoe) technology
- Sport
- Science
The user of the GeBioM pressure distribution measuring systems is always given an introduction when the systems are delivered, e.g. online or on site. This includes basic handling of the systems, exclusion criteria for certain measurement situations (e.g. do not use sharp objects, etc.) and an introduction to the evaluation options of the respective system. The specialist knowledge required to analyse the results is assumed. The devices cannot be used contrary to their intended purpose according to normal judgement. The measures taken by the user based on the respective measurement results are always subject to his personal expertise and philosophy.
The systems are designed in such a way that the respective test person (in industry usually employees of the respective department, in sales consulting the customer, in orthopaedic (shoe) technology the customer/patient) is not significantly influenced by the movement of the measuring sensors. The subject merely walks across the measurement field.
Important: Make sure that the measuring foil is not damaged by sharp objects.
objects is loaded. This could cause the sensors to malfunction.
1.3.Calibration cycles
GeBioM recommends regular calibration of the measuring system by the manufacturer, at least once a year. If the system is used almost daily, the calibration should be repeated more often.
2.Hardware MultiSens-WiFi
2.2.Installation and commissioning
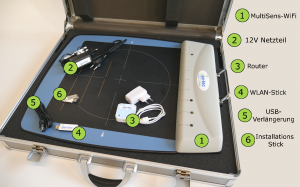
- Install the GP Manager from the enclosed USB stick (6) or with the help of an installation or update link. You will be guided through the individual steps of the installation.
- Once the GP Manager has been successfully installed, plug the WLAN router (3) into a nearby socket. It is used for data transmission and must be supplied with power during the entire measurement process. If no power socket is available, use the USB port on your PC as a power source. The router and the disc each have a sticker with the serial number (blue). If you have several MultiSens WiFi discs, make sure that the router and disc are assigned correctly!
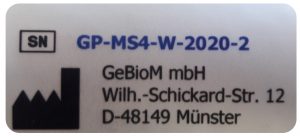
Remark: Please press not the reset button on the router. As a result, you will no longer be able to carry out measurements as important settings will be deleted. - Data is transferred between the platform and computer via WLAN. If your PC already has a WLAN interface because you are using the platform on a laptop, for example, you can use the internal WLAN interface on your laptop. If your PC does not have a WLAN interface, use the WLAN stick (4). Plug this into a free USB port on your computer and ideally use the USB extension cable (5) to ensure an interference-free wireless connection. The WLAN stick normally installs itself automatically if an Internet connection is available. If the WLAN stick does not install automatically, please download the appropriate driver from the manufacturer's website:
tp-link.com/en/download/TL-WN821N.html#Driver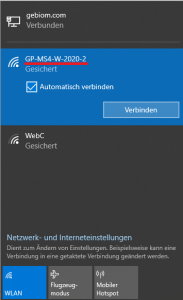
Figure 2: Establishing a connection with the router
- Connect to the WLAN of the router. This corresponds to the serial number of your disc. To do this, click on the network symbol (
 or
or  ) in the bottom right corner of the screen and then click on "GP-MS4-W-20xx-xx" (see figure 2). Then click on "Connect". The password is: 12345678
 - Switch on the MultiSens platform (1). The switch is located next to the handle. The platform has an integrated rechargeable battery. The battery life is approx. 10 hours. The platform may only be charged using the enclosed mains adapter (2) and can also be operated during the charging process.
- The platform has four LEDs:
- green = Power ON,
- red = battery is charging
- orange = battery is fully charged
- white = platform has connected to WLAN router
- Now open the already installed GP Manager and start a measurement in the GP foot pressure module.
3.GP FussDruck software module
With the software module GP FootPrint the plantar pressure distribution in the barefoot gait is measured and can then be analysed.
3.1.Overview
To start the module, you must first select a customer or create a new one. To do this, click on the following icon in the top right-hand corner ![]() . To create a new customer, click on
. To create a new customer, click on ![]() and fill in at least the mandatory fields marked with an *. Click on the arrow to return to the start page and start the GP FussDruck module.
and fill in at least the mandatory fields marked with an *. Click on the arrow to return to the start page and start the GP FussDruck module.
This takes you to the user interface of the measured value recording module. This module is used to record measured values from the connected GeBioM hardware and process measurements. At the top right, you can switch between the two measuring systems MobilData and MultiSens can be selected. If you have not already done so, please select MultiSens. The left-hand side is selected on the user interface, which can be recognised by the red border. At startup, the left foot is activated by default.
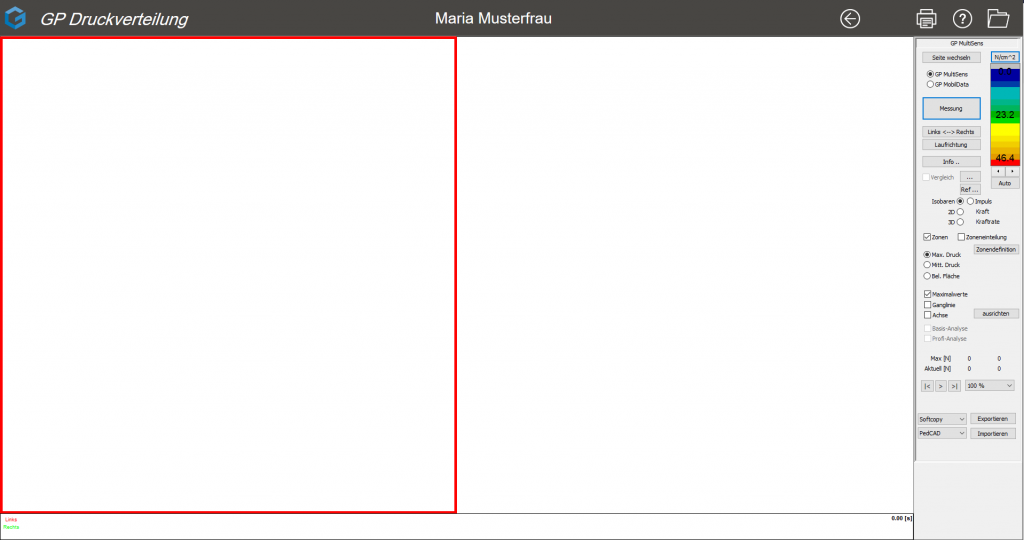
Figure 3: User interface
3.2.Live dialogue
After clicking on "Measurement", the live dialogue opens. The patient stands approx. 2-3 steps away from the measuring platform and walks over the platform with their left foot at their usual walking speed (see Fig. 4). The measurement is saved automatically immediately afterwards. After the left foot has been measured, the right measurement field is selected on the user interface and the "Measure" button is clicked again.
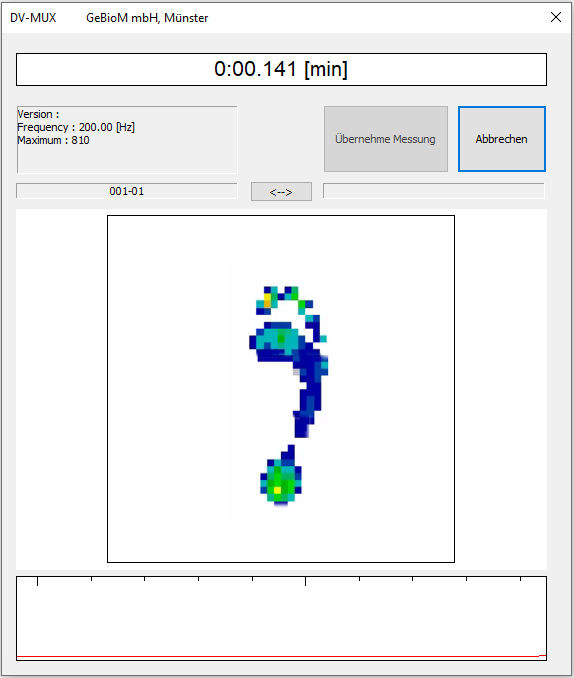
Figure 4: MultiSens live dialogue
3.3.Presentation and analysis
After a measurement, the totalised pressure distribution is displayed (see Figure 5). The colour of the display provides information about the level of pressure. With a click on ![]() At the top right, older measurements of the customer can be selected.
At the top right, older measurements of the customer can be selected.
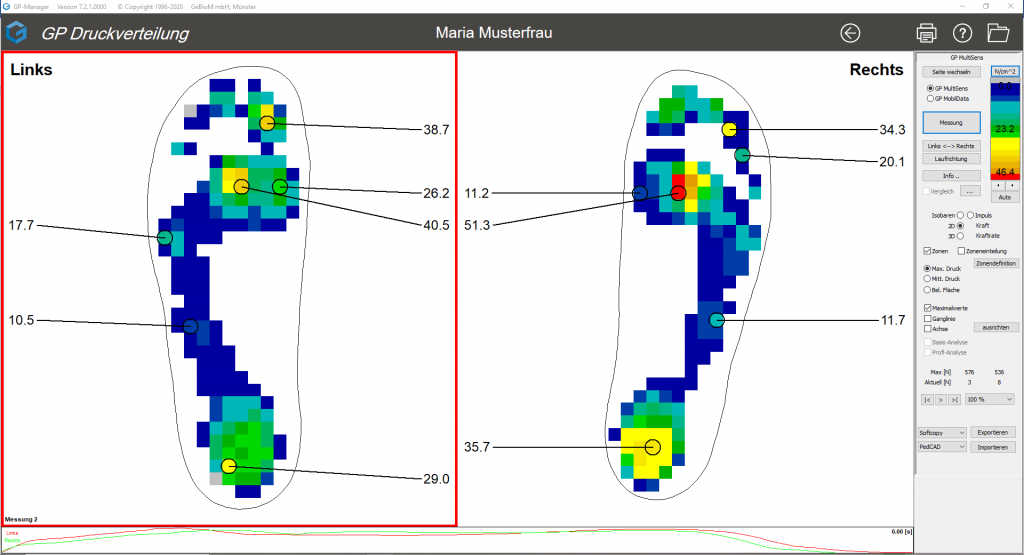
Figure 5: Illustration of the pressure distribution
3.3.1.Customise display
If the feet are inadvertently displayed incorrectly, the display can be changed by clicking on "Left Right" and "Running direction".

3.3.2.Info
By clicking on "Info...", you can enter information about the recorded measurement. This is then displayed in the display area at the bottom left.
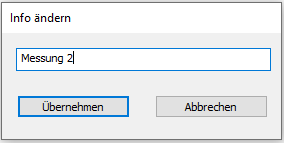
Figure 6: Info text field
3.3.3.Legend
The legend is shown at the top right and provides information on the

Figure 7: Legend
Amount of pressure in the respective foot region. The warmer the colour, the higher the pressure. The unit of pressure is given as standard in Newtons per cm² (N/cm²). In a MultiSens measurement, a pressure range of approx. 23 N/cm² is shown in green and the foot region that exceeds a pressure value of 46 N/cm² is shown in red.
3.3.4.Force-time diagram
Below the pressure distribution is the force-time diagram (see Figure 8). In it, the total force is plotted as a function of time. The force progression of the left foot is shown as a red line and that of the right foot as a green line.

Figure 8: Force-time diagram
A simple left mouse click in the diagram selects a point in time and displays the respective pressure distribution image in the display area. The selected point is indicated by a black vertical marker and the time is shown in seconds at the end of the force-time curves. At the same time, the current force values are displayed on the right in the "Current [N]" line.
If you move the marker while holding down the left mouse button, a "quasi real-time" display of the gait pattern is shown. The right or left arrow key on the keyboard offers another option for scrolling through the gait pattern. The scrolling direction corresponds to the arrows.
You can also zoom into a specific area of the diagram. To do this, press the CTRL key and simultaneously drag a rectangle with the mouse (left mouse button) over the area to be zoomed. The entire measurement is displayed again by left-clicking while holding down the CTRL key.
3.3.5.Zones
Each foot is divided into different zones so that it can be
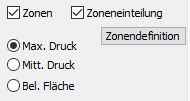
can be analysed in more detail. If you activate the "Zoning" checkbox, the zones are displayed in colour. The following 6 zones are defined for the stance: Heel, midfoot, ball of foot inside, ball of foot centre, ball of foot outside, toes. You can find an overview by clicking on Zone definition.
If the "Max. pressure" selection is activated, the height and location of the maximum pressure of the respective zone is displayed. Alternatively, you can also display the average pressure or the size of the loaded area [mm²] of the respective zone. Here too, you can jump to any point in the force-time diagram.
You can read how to define the zones individually according to your requirements in chapter 3.3.9.
3.3.6.Comparison
You can compare the currently open measurement with another measurement. To do this, click on the button ![]() and select the desired comparison measurement in the preview window.
and select the desired comparison measurement in the preview window.
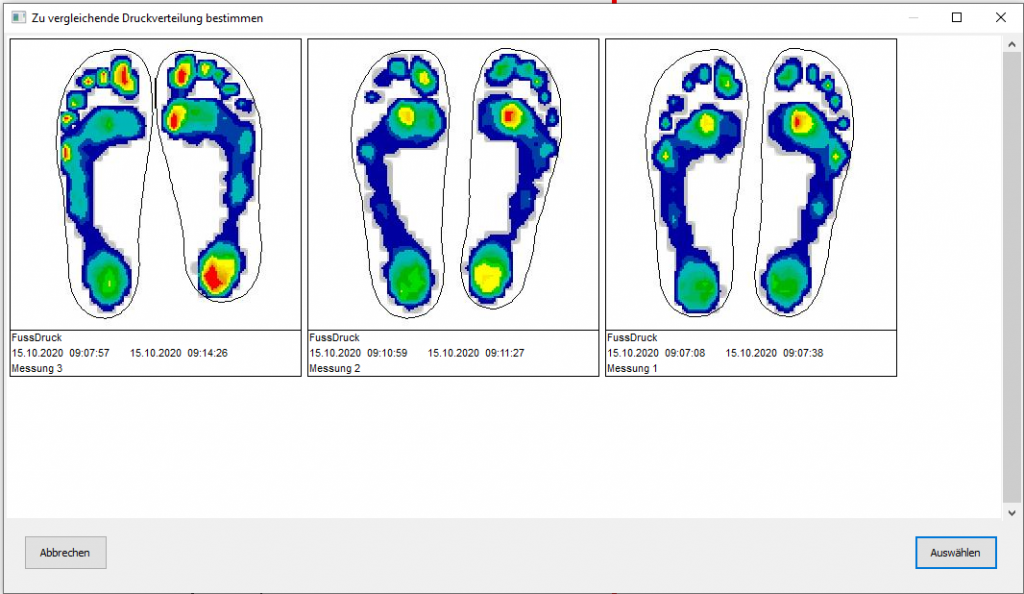
Figure 9: Select comparative measurement
To see the selected comparison, you must tick the checkbox in front of the comparison![]()
If you deactivate the checkbox, you will return to the initial measurement.
3.3.7.Display variants
3.3.7.1.Isobars
In the default setting, the pressure distribution is shown in the isobar display (see Figure 10).

The various high pressure ranges merge seamlessly into one another. The "Isobars" radio button is activated.
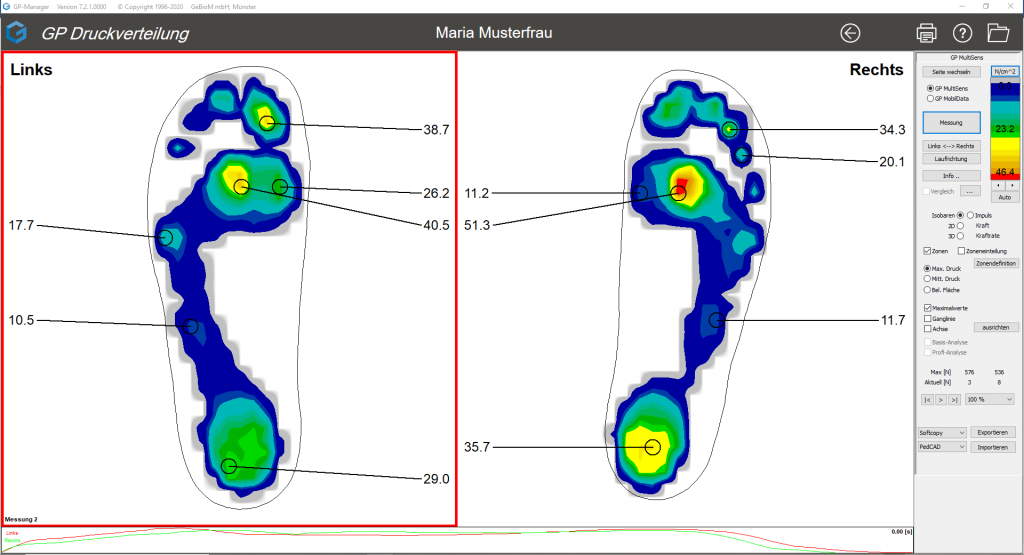
Figure 10: Isobar representation
3.3.7.2.2-D
After activating the "2D" radio button, the print image is displayed in the form of colour fields/pixels.
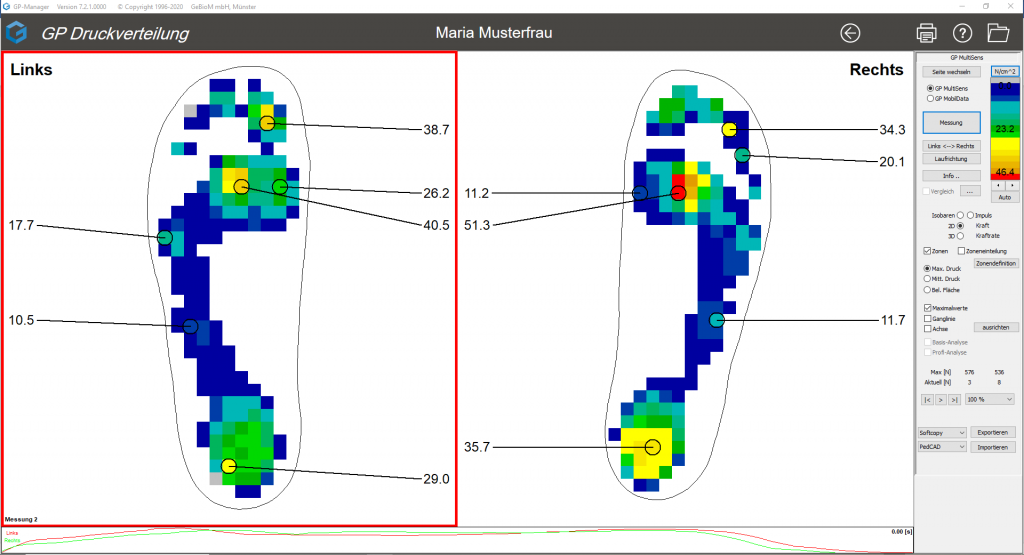
Figure 11: 2D representation
3.3.7.3.3-D pressure mountains
The "3D" radio button causes a change to a 3D pressure map. Please note that this only applies to the gait pattern of the active zone (red rectangle). The "Change page" button at the top of the screen allows you to quickly switch to the other measured foot.
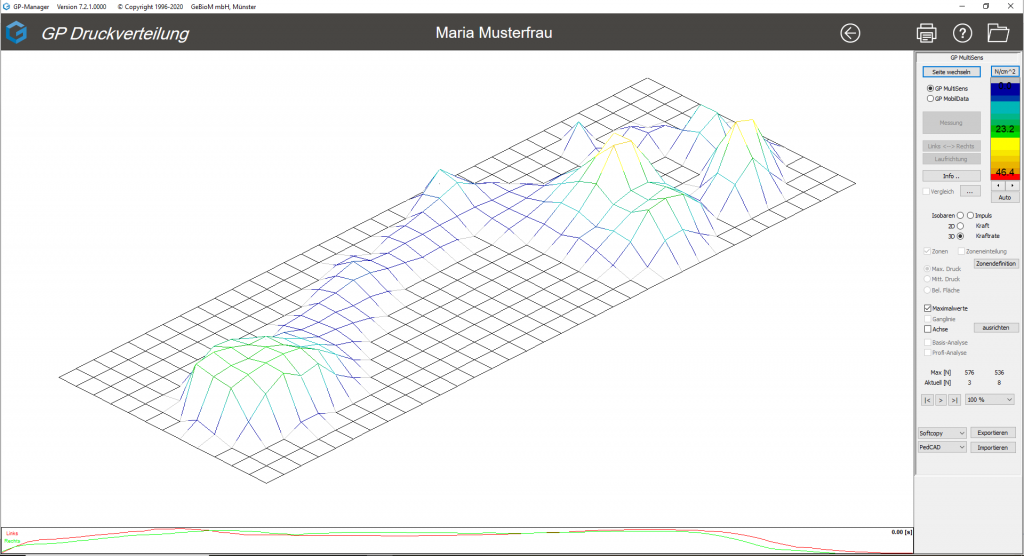
Figure 12: 3D printed mountains
You can view the 3D visualisation from different perspectives. Click in the workspace and rotate the measurement while holding down the left mouse button.
By moving the mouse vertically while holding down the CTRL key, the print area is raised or flattened. This function can be useful when preparing a printout.
3.3.8.Impulse, force, force rate
By activating the "Impulse, force, force rate" radio button, the force-time diagrams are displayed for all defined zones. The impulse, maximum force and force rate are also calculated for each zone. 
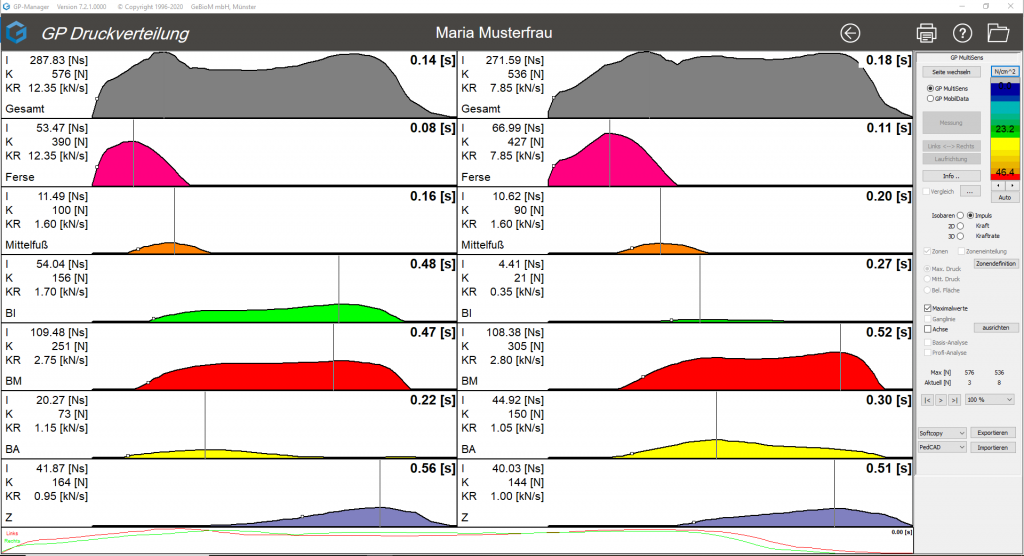
Figure 13: Illustration of impulse, force, force rate
These biomechanical parameters, which can be seen on the left of the curves, are helpful for a detailed gait analysis.
| Parameters | Abbreviation | Unit | Calculation | Marking | Biomechanical significance |
| Impulse | I | Newton*sec [Ns] | Area under the curve (integral) | coloured area | Combination of height and duration of the load.
The greater the impulse, the higher and longer the load. |
| Maximum force | K | Newton
[N] |
highest point of the curve | vertical line | Amount of load at an isolated point in time.
The higher the maximum force, the higher the short-term load. |
| Force rate | KR | Kilonewton per sec.
[kN/s] |
Steepest ascent of the curve | small, white square | Speed at which the force is applied.
The higher the force rate, the weaker the cushioning at heel strike. |
3.3.9.Zone definition
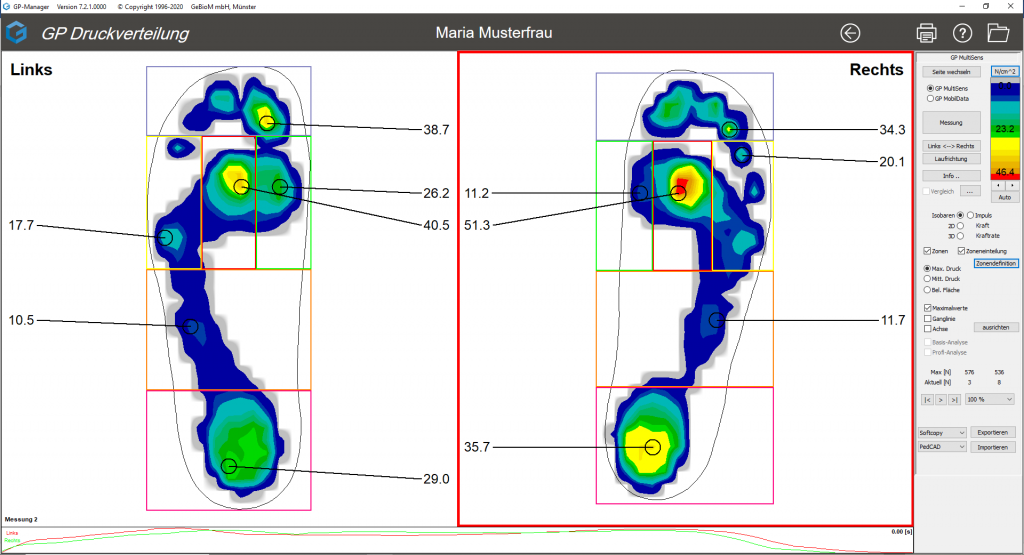
Figure 14: View of the different zones and their maximum pressure values
It is possible to edit the zones manually. This function is only possible if "Axis" is not ticked. All changes made on one foot side are automatically transferred to the other foot side. Operation is carried out by holding down the Ctrl key. There are several options:
- Change an existing zone
- click on the zone to be changed while holding down the Ctrl key and change the size of the zone at the corner or side points with the mouse, or change the position of the zone while holding down the mouse button in the zone
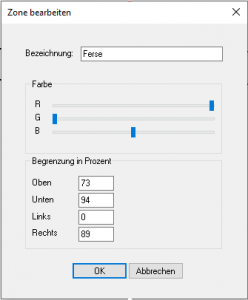
Figure 15: Edit zone
- double-click in the zone while holding down the Ctrl key to open a new window (see Figure 15). Here you can change the name, the colour by moving the sliders and the size and position of the zone by entering the coordinates, whereby the numbers indicate the position of the zone as a percentage (e.g.: Top-0, Bottom-100, Left-0 and Right-100 encloses the entire foot).
- click on the zone to be changed while holding down the Ctrl key and change the size of the zone at the corner or side points with the mouse, or change the position of the zone while holding down the mouse button in the zone
- Define a new zone
- A window can be opened by holding down the Ctrl and Shift keys. This is then a new zone and can now be edited in the same way as under 1.) "Change existing zone".
If a change has been made under 1.) or 2.), the option "Save zones" appears (see Figure 16). The changed zone arrangement can be overwritten there or a new zone can be created.
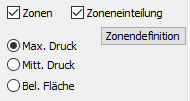
Figure 16: Save zone
By clicking on "Zone definition", you can select from the list of zones that have already been created (see Figure 17). The selected zoning is displayed graphically and it is possible to delete a previously defined zoning.
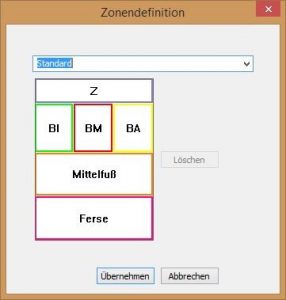
Figure 17: Zone definition
3.3.10.Aligning the foot axles
If the feet are not displayed exactly vertically, the defined zones may not correspond exactly with the foot. The zones can be rotated by activating the tick next to "Axis", aligning the red axis with the foot and then clicking on "Align". ![]()
3.3.11.Maximum values
The "Maximum values" checkbox displays the maximum value for each foot zone (see Figure 14). This display is also active when an old measurement is called up.
3.3.12.Hydrograph
By activating the "Chart" checkbox, the chart is shown in the measurement display (red line). The pressure centre is calculated at every point during the measurement. This is marked as a point in the dynamic progression. The hydrograph represents the connection of the pressure centres of all individual images and is to be interpreted as the point of application of the body's centre of gravity.
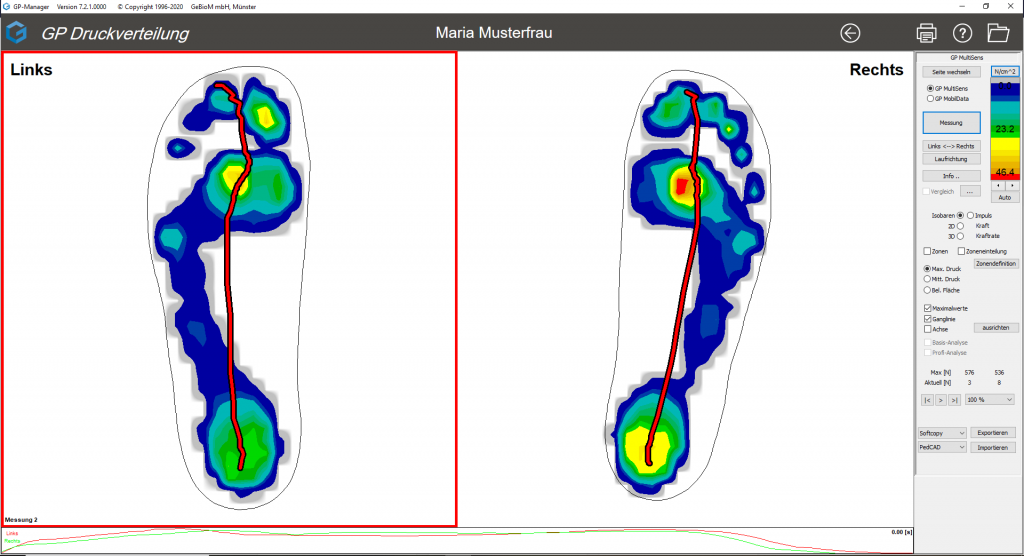
Figure 18: Hydrograph
3.3.13.Basic analysis / Professional analysis
When the comparison is activated (see 3.3.6 Comparison), the "Basic analysis" and "Professional analysis" boxes become active. These provide a comparison of the measurement data for the two measurements shown. After clicking on one of the two options, a table appears at the bottom of the screen in which various measurement data are compared with each other.
The basic analysis is divided into rearfoot and forefoot. The maximum pressure and impulse parameters are listed next to each other and the percentage deviations of the compared measurements are calculated.

Figure 19: Basic analysis
The professional analysis is divided into all foot zones (standard - 6 zones). The parameters Maximum pressure, Average pressure, Loaded area, Impulse, Force and Force rate are listed next to each other and the percentage deviations of the compared measurements are calculated. If the analysis is activated, the table also appears on the printout.

Figure 20: Profile analysis
3.3.14.Player function
A player function is inserted at the bottom right of the control panel.![]()
This ensures that the dynamic measurement runs automatically. Click on the ">" play button to run the measurement automatically. When the measurement is running, a vertical line moves across the force-time curves at the bottom of the screen. Clicking the play button again stops the process and the vertical line remains at the corresponding position. As before, it is also possible to run the programme manually using the mouse or the cursor keys. By changing the percentage next to the player functions, it is possible to slow down the sequence from 30% to 100%. If the automatic sequence is paused, the measurement can be switched forwards and backwards in individual frames using the two arrow keys next to the play button.
3.4.Importing and exporting measurements
You have the option of exporting the measurement you are currently viewing. The corresponding buttons can be found at the bottom right, or in older versions of the GP Manager under the cogwheel symbol.
The following export formats are available: Softcopy, DV Scan, JPG, PedCAD and ASCII. Select the desired file format from the drop-down menu and then click on "Export". Once you have selected the desired storage location, the corresponding file is exported.
Note: The entire customer is not exported. Use the "GP GPF" module for data backup or similar.
To import a PedCAD file, click on "Import" and select the desired file from the corresponding storage location.
3.5.Print
Measurements can be taken by clicking on the printer symbol ![]() (top right) can be printed out. Various display options are available to you. If the basic or professional analysis is activated, the tables also appear on the printout.
(top right) can be printed out. Various display options are available to you. If the basic or professional analysis is activated, the tables also appear on the printout.
4.Quick guide
- Plug the WLAN router (3) into a nearby socket. WLAN of the router corresponds to the serial number of the disc (GP-MS4-20xx-xx)
- Establish WLAN connection between router and PC (Password: 12345678)
- Switch on MultiSens platform (1)
- On the start page of the GP Manager, click the customer button
 Select and create new customer or search for existing customer
 - With the arrow
 Take over the customer and return to the start page
 - Open GP foot pressure module
- The hardware GP MultiSens select
- Click on "Measurement" to start the measurement
- First walk over the platform with your left foot, then with your right foot
- The measurement is automatically saved and can then be analysed.
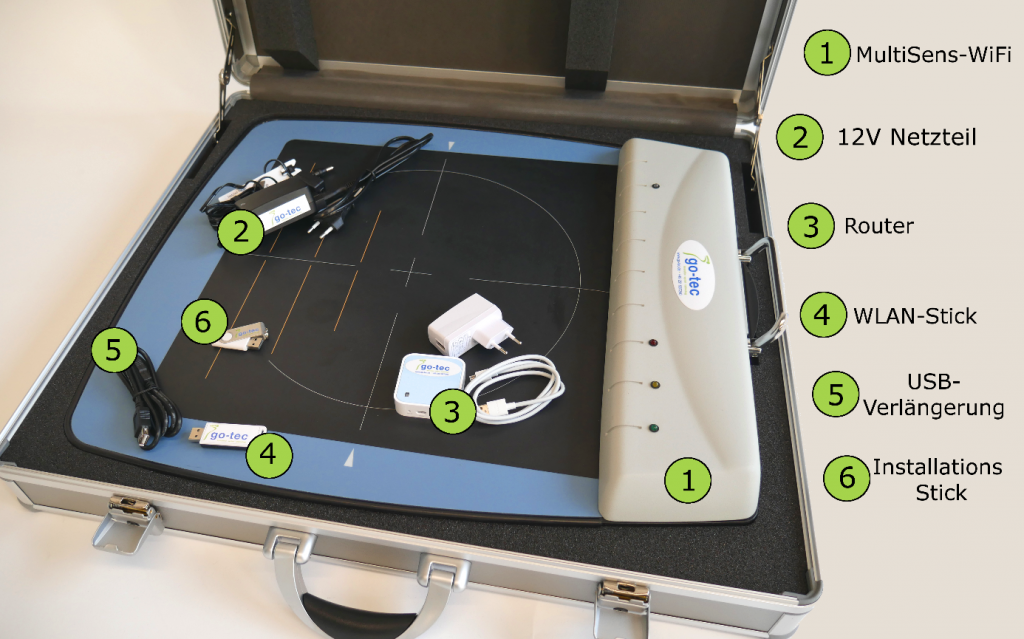
Figure 21: Overview of scope of delivery

