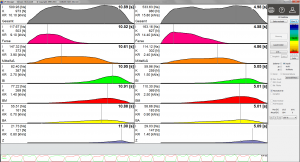
Impulse, force, force rate
After activating the "Impulse, force, force rate" radio button, gait patterns are displayed in the form of force-time diagrams. All defined zones are taken into account. In addition, an overall force curve (grey here) is displayed.
The diagrams are based on one step each (right and left). The step that comes closest to the average contact time of all steps is displayed.
Common to all diagrams is the visualisation of the relevant biomechanical parameters:
