Depending on the hardware used (GP 3D BackScan or GP EasyScan 3D), the marker points are found automatically or manually. To ensure the correct position of the points, the end points of the lines can be moved with the left mouse button.

The measured values are displayed in the evaluation area.

A traffic light display (red, green, yellow) is intended to provide an initial signal as to whether the measurement data is in a critical, acceptable or good range.

The following values are displayed in the table (all values are given in degrees):

Lateral plumb bob: Here you can see the deviation of the person in the lateral perpendicular. In other words, it shows how many degrees the line between C7 and L3 deviates in the sagittal plane.

Frontal plumb bob: Here you can see the deviation of the person in the frontal perpendicular. In other words, it shows how many degrees the line between C7 and L3 deviates in the frontal plane.

Shoulder height: Here you can see the deviations of the person in the height of the shoulder. In other words, it shows how many degrees the line between the shoulder blades deviates in the frontal plane.

Shoulder rotation: Here you can see the deviations of the person in the rotation of the shoulder. In other words, it shows how many degrees the line between the shoulder blades deviates in the sagittal plane.

Pool height: Here you can see the deviations of the person in the height of the pelvis. In other words, it shows how many degrees the line between the SIPS deviates in the frontal plane.

Rotation basin: Here you can see the deviations of the person in the rotation of the pelvis. In other words, it shows how many degrees the line between the SIPS deviates in the sagittal plane.
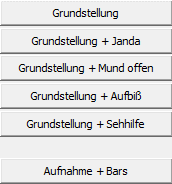
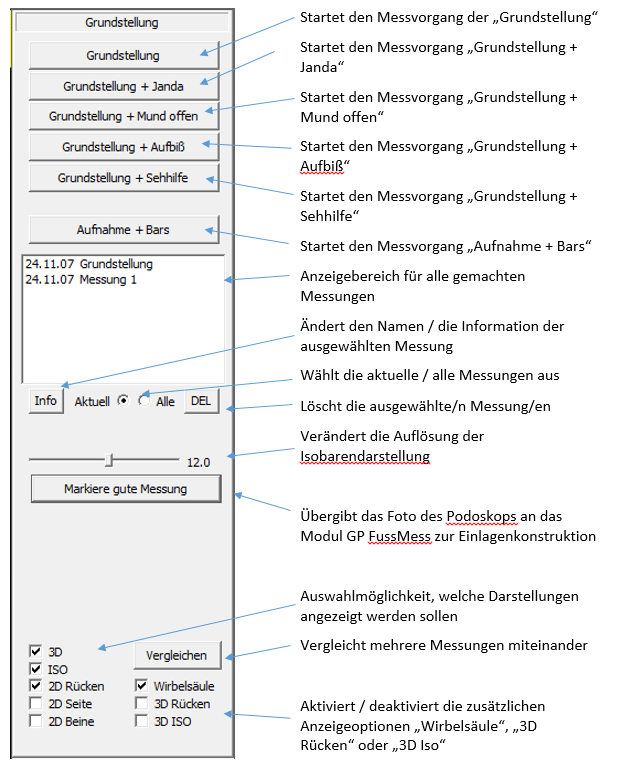
All operating elements are assigned different functions. A detailed description of these functions can be found below.

  1. Recording and labelling measurements

All of the buttons listed actively start a measurement process. The different names of the buttons help you to directly identify the measurements taken. In addition to documenting the basic posture (normal stance), different changes (e.g. Janda = toes curled) can be used to localise the cause of the back problems. This procedure was developed by the association "Deine Haltung e.V.". If you would like more information on this type of diagnosis, please contact us.

Depending on the connected scanner (GP 3D BackScan or GP EasyScan 3D), a slightly different looking live image of the scanner opens. The measurement process for the GP EasyScan 3D scanner starts automatically and ends after a set number of seconds. Both (the automatic start and the automatic end) can be changed if required. The duration of the measurement process is also variable.

The measurement process for the GP 3D BackScan scanner must be actively started. To do this, please click on the "Measure" button in the live image displayed. Please pay attention to the selected measuring range, which is slightly highlighted in red. You can find more information on this in the Preparing for measurement chapter.


2. Select, rename and delete measurements

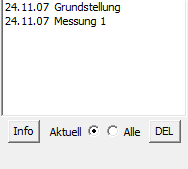
The recorded measurements are displayed in the selection area. To display the measurement, click on the desired measurement with the left mouse button, hold down the mouse button and then drag and drop it into the display area. You can change the name of the measurement using the "Info" button. The "Current" and "All" selection buttons help you to activate the respective measurements. The active measurements are highlighted in blue in the selection window. The "DEL" button stands for "Delete" and deletes the selected measurements. Please note that this step is final. Deleted measurements cannot be restored.


3. change isobar resolution, transfer 2D measurement

The slider can be used to change the resolution of the isobar display. Distinctive points (protruding shoulder, etc.) can be better visualised by changing the resolution.

The "Mark good measurement" button transfers the desired measurement from the podoscope to the GP FootMess software module. The measurement can then be prepared for insole construction.


4. change display options, show additional functions

You can use the "Compare" button to compare up to three measurements with each other. To do this, select the measurements to be compared in the selection window by holding down the Ctrl key and then click on the "Compare" button. The desired comparison is first displayed in the isobar display.

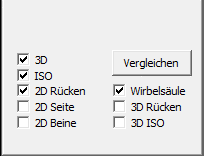
The display format can be freely selected by ticking the boxes. Both in the comparison and in the display of just one measurement, you can select the display format in which the measurement is to be displayed by ticking the boxes.

The additional function "Spine" activates or deactivates an additional line that can be shown or hidden. This line consists of 5 points and helps to trace and visualise the course of the spine.

The "3D back" and "3D ISO" functions also superimpose the photo or isobars on the 3D display.


All operating elements of the "GP BackScan" software are located on the right-hand side of the user interface. You can use these elements to trigger numerous functions.


The individual operating elements are explained in more detail below.

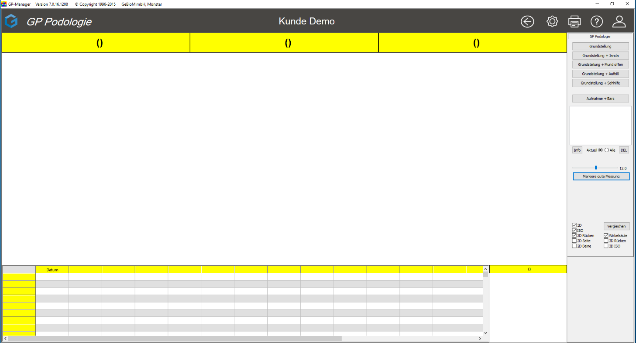
After starting the "GP BackScan" software module, the following user interface opens:

It is used to record and process the measurement data.

The user interface can be divided into 4 parts.

  1. The display area

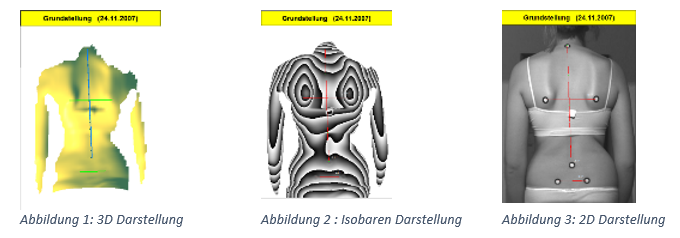
Three different types of measurements are displayed in the upper left part of the user interface. In the first part of the window, the back is displayed in 3D (see Fig. 1), in the centre part in an isobar display (see Fig. 2) and in the right part as a 2D photo (see Fig. 3).

2. the evaluation range

In the lower part of the user interface, you will see a table in which the measured values are displayed.

3. the operating elements

The operating elements of the software module are located on the right-hand side of the user interface.

The software is controlled via these operating elements.

Here you can start, name, delete or compare measurements.

Thanks to the clear arrangement of the controls, all functions can be started and called up directly.

You will find a detailed description of all operating elements in Chapter 2 - Operating elements


4. The podoscope

In addition to the table of the evaluation range and the operating elements, a photo of a connected podoscope can be displayed.

To open the "GP BackScan" software module, click on the "GP BackScan" button in the module overview.

Of course, all measurement recording programmes are part of the GP Manager. If you need help using the GP Manager (How do I create a customer? etc.), you will find this in the GP Manager user manual.