Impulse, force, force rate
By activating the "Impulse, force, force rate" radio button, the force-time diagrams are displayed for all defined zones. The impulse, maximum force and force rate are also calculated for each zone. 
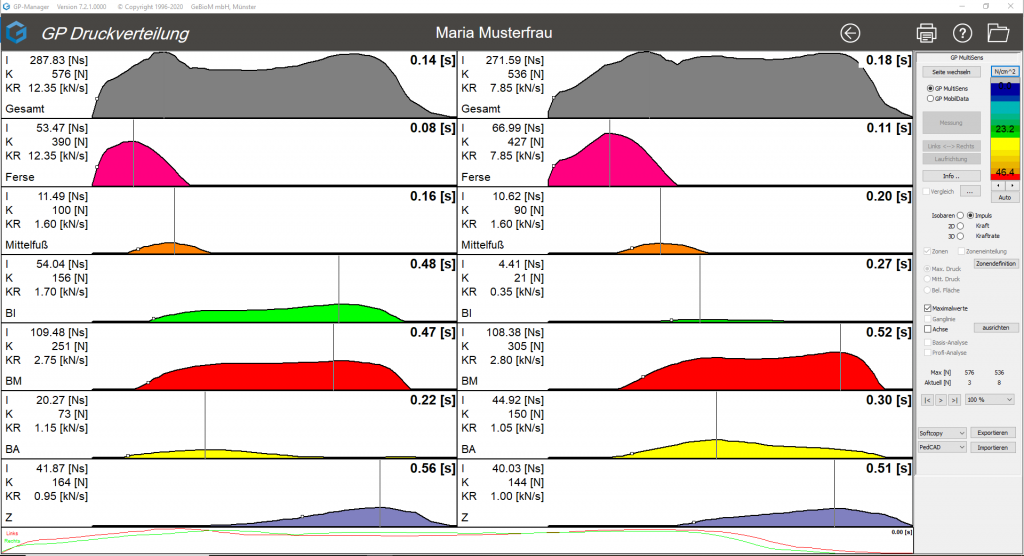
Figure 13: Illustration of impulse, force, force rate
These biomechanical parameters, which can be seen on the left of the curves, are helpful for a detailed gait analysis.
| Parameters | Abbreviation | Unit | Calculation | Marking | Biomechanical significance |
| Impulse | I | Newton*sec [Ns] | Area under the curve (integral) | coloured area | Combination of height and duration of the load.
The greater the impulse, the higher and longer the load. |
| Maximum force | K | Newton
[N] |
highest point of the curve | vertical line | Amount of load at an isolated point in time.
The higher the maximum force, the higher the short-term load. |
| Force rate | KR | Kilonewton per sec.
[kN/s] |
Steepest ascent of the curve | small, white square | Speed at which the force is applied.
The higher the force rate, the weaker the cushioning at heel strike. |