By clicking on „Start Measurement“ the measurement is recorded. The measurement is recorded until the button „apply measurement“ is clicked.

By clicking on „Start Measurement“ the measurement is recorded. The measurement is recorded until the button „apply measurement“ is clicked.
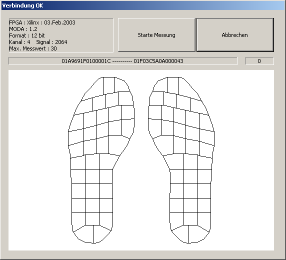
The „measurement“ function serves to record the measurement values of the radio system. After clicking on „measurement“ the view is changed to the window below.

If measurement areas are connected to the sender and if the sender is active, the measurement areas are directly displayed.
All measurement areas possess a specific coding. The precondition for the display is a correct calibration file. All measurement areas are delivered calibrated by GeBioM mbH. The respective calibration file is contained in the sub-folder \GPSYSTEM\KAL.
In the lower right corner of the control panel a player function has been inserted. This ensures the automatic operation of the dynamic measurement. By clicking on the play-button „>„, the measurement starts automatically. When the measurement is played, a vertical line runs over the force-time diagram in the lower part of the screen. By clicking the play-button again the measurement is paused and the vertical line stays at the respective moment. The manually moving the stripe with the mouse or by using the arrow-keys is also possible. The per cent indication next to the player function slows the record down to between 30% and 100% of the original speed. When the automatic run is stopped, the measurement can be re-run in single pictures by using the two arrow-keys next to the play button.
![]()
![]()
When the comparison option is activated (click on ‚…‘, select a comparison measurement, tick the „comparison“ box) the boxes „Basic-Analysis“ and „Pro-Analysis“ are active. These offer a comparison of the measurement data for the two displayed measurements. After clicking on one of these options a table appears at the lower screen, which contains the comparison of different measurement data. When using the „Basic-Analysis“ the feet are divided into forefoot and hindfoot. The parameter maximal pressure and impulse are listed next to each other and the percental difference of the compared measurements are calculated. When using the „Pro-Analysis“ the feet are divided into 6 zones (standard). The parameter maximal pressure, mean pressure, loaded area, impulse, force and force rate are listed next to each other and the percental difference of the compared measurements is calculated.

(Basic-Analysis)

(Pro-Analysis)
By activating the control box „line of walking“ a line of walking is added to the measurement display. At each point in time during the measurement the pressure centre is calculated. This is dynamically marked as a point. The line of walking connects these pressure centres of all individual pictures and is to be interpreted as the centre of gravity’s point of contract.

By activating the control box „areas“ and selecting a corresponding parameter „Max. Pressure„, „Mean Pressure„, or „Loaded Area“ the respective values of the areas are displayed on the working surface.
Here you need to decide whether the values are displayed for a specific point in time (time diagram) or for the specific areas „Max. Pressure„, „Mean Pressure“ or „Loaded Area„.

Now there is the possibility to manually adjust the areas. Using this function is only possible when the axis is set, or formulated differently, if the axis box is not ticked. All changes that are conducted on one feet side, are automatically transferred to the other side. This option operates when the CTRL-key is held down. There are multiple possibilities:
If area have been changed as described under 1.) and 2.) there is the possibility to „save areas“ (see screenshot-05). There the changed area can be overwritten or saved as a new area. In the latter case a new name for this area needs to be entered.
By clicking on „definition of areas“ a list of the saved areas can be selected (See screenshot-06). The selected area arrangement is displayed graphically and there is the possibility to delete a previously defined area arrangement.

(screenshot-04)

(screenshot-05)

(scrennshot-06)
GP MobilData
Changes in the area definition are conducted just as in MultiSens. The only difference is that the axes cannot be adjusted. Accordingly, it is neither necessary nor possible to un-tick the axis-box. Elsewise, the functions are identical.
When the „Maximum“ control box is ticked, the maximum value measured by each sensor in the time given in the force-time diagram is displayed.
After activating the options field „Impulse, Force, Force rate“ the gait patterns are displayed as force-time diagrams. All defined zones are taken into account. Furthermore, a total force progression is displayed (here grey). The diagrams are all based on a single step (right and left). In doing so, the step is displayed that comes closest to the mean contact time of all steps.
All diagrams share the display of the relevant biomechanical parameter:
